


Mapping magic with FieldView
May 19, 2022
Ready to take your FieldView experience to the next level? One of the best ways to maximize your value is to take advantage of in-field, equipment-based data collection and mapping applications.
Educating farmers on the most effective ways to capture farm data is part of the role of Geni Wiens, a Digital Account Specialist (DAS) with FieldView. “Whenever a customer signs up with FieldView for the first time, it’s part of my job to show them how to use FieldView ,” says Wiens. “We cover important topics such as equipment compatibility, hardware needs and various tools – such as imagery, weather and scouting tools – with an overall goal to make sure they are comfortable with the platform. We also provide support to dealers.”
There are a range of customer questions and interests, says Wiens. Some dive head-first into using FieldView in the cab while others prefer to wade in. In the end, as growers get more familiar with the platform there becomes a greater focus on in-cab use and adding increasingly more detailed map layers to unlock the full power and benefits of the digital platform
“Once your data collection and mapping shifts into the field, a whole new world of opportunity opens up,” she says. “Taking the steps to apply some ‘mapping magic’ can go a long way to getting more out of the platform – leading to greater efficiency, better precision and ultimately better results such as fewer issues and higher yields.”
As a new FieldView user, once you have the basics in place – your account set up, field boundaries mapped and your equipment connected – you are ready to start capturing your application data directly from the field.
Typically, this involves adding the FieldView Drive™ to your compatible equipment, then following a series of straightforward steps on your iPad, to record and map the data for each new application (FieldView team members like Geni are available to help). Your data is then instantly collected and mapped as you conduct each new application, providing a wealth of data you can use to monitor progress and analyze what’s working on your operation – and what isn’t.
“Like with anything, you tend to invest more where you see the value,” she says. “Nine times out of ten farmers consider their sprayer the most valuable asset they have on their farm in terms of importance to the operation. They see the value there and it’s natural to want to analyze that information more closely. That opens the door and then for many – the use of the platform just continues to grow into more equipment and options.”
The details of how to capture your as-applied data are simple and practical, she says:
- Reach out to FieldView support team to get help determining your equipment compatibility (for example, for a sprayer this may include compatibility for the sprayer GPS, rate controller and monitor, as well as the make and model of the sprayer itself).
- Identify equipment needs such as FieldView Drive hardware, cables etc. and then get everything installed.
- Connect with API partners to align your FieldView platform with other compatible software (again, your advisors can help with this). FieldView has broad compatibility with industry partners to pull together and optimize information across multiple platforms.
- Start using your Drive and iPad to map new applications/activity on the platform. This is all done easily by following simple screen prompts. Check out these FAQs on FieldView cab app sprayer applications.
The value you gain with mapping applications comes in many forms, she says, including the ability to conduct your own trials to see which application strategies and products are the best fit for your farm. See how to set up your virtual application shed here.
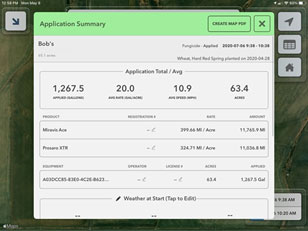
For one recent example, a grower Wiens works with used FieldView to compare fungicide applications – essentially conducting an on-farm trial with two different fungicide products on wheat. The mapping process captured a range of data, now at his fingertips, to allow for quick comparisons taking into account a wide range of variables from spraying dates and rates to seeding data and weather. See how to conduct this type of application trials here.
In another example, this grower used FieldView maps to evaluate the performance of different crop growth regulators. It showed a major yield advantage of 104 bushels per acre with one product versus 95 bushels with the other.


“Every field is unique so there’s a lot of value in being able to conduct your own on-farm trails,” says Wiens. “These are the types of insights that can quickly pay off and make a big difference to the success of your farm.”
Check out this cab chat to hear more about how Taya from Alberta, uniquely uses FieldView to map applications.